💸 Lost money in crypto last year? You can save thousands on your taxes.
Learn more🔍 SURVEY: Most investors don’t know that crypto losses can lead to massive tax savings!
Learn more
The Bitcoin Rainbow Chart uses the colors of the rainbow to help you understand whether BTC is overpriced/underpriced based on historical trends.
The Bitcoin Rainbow Chart uses a logarithmic regression curve that takes into account years worth of historical data. The chart is overlaid with colors of the rainbow to give a simple visual guide on how Bitcoin is performing relative to its history.

The Bitcoin Rainbow chart uses past performance to forecast different price outcomes for BTC.
The bottom of the rainbow represents the 1st percentile outcomes (the most pessimistic forecast for Bitcoin based on previous performance). If the current price of BTC is closest to the 1st percentile outcome, it may be a sign that BTC is undervalued.
The top of the rainbow represents 99th percentile outcomes (the most optimistic forecast for Bitcoin growth based on previous performance). If the current price of Bitcoin is closest to the 99th percentile outcome, it may be a sign that BTC is overvalued!

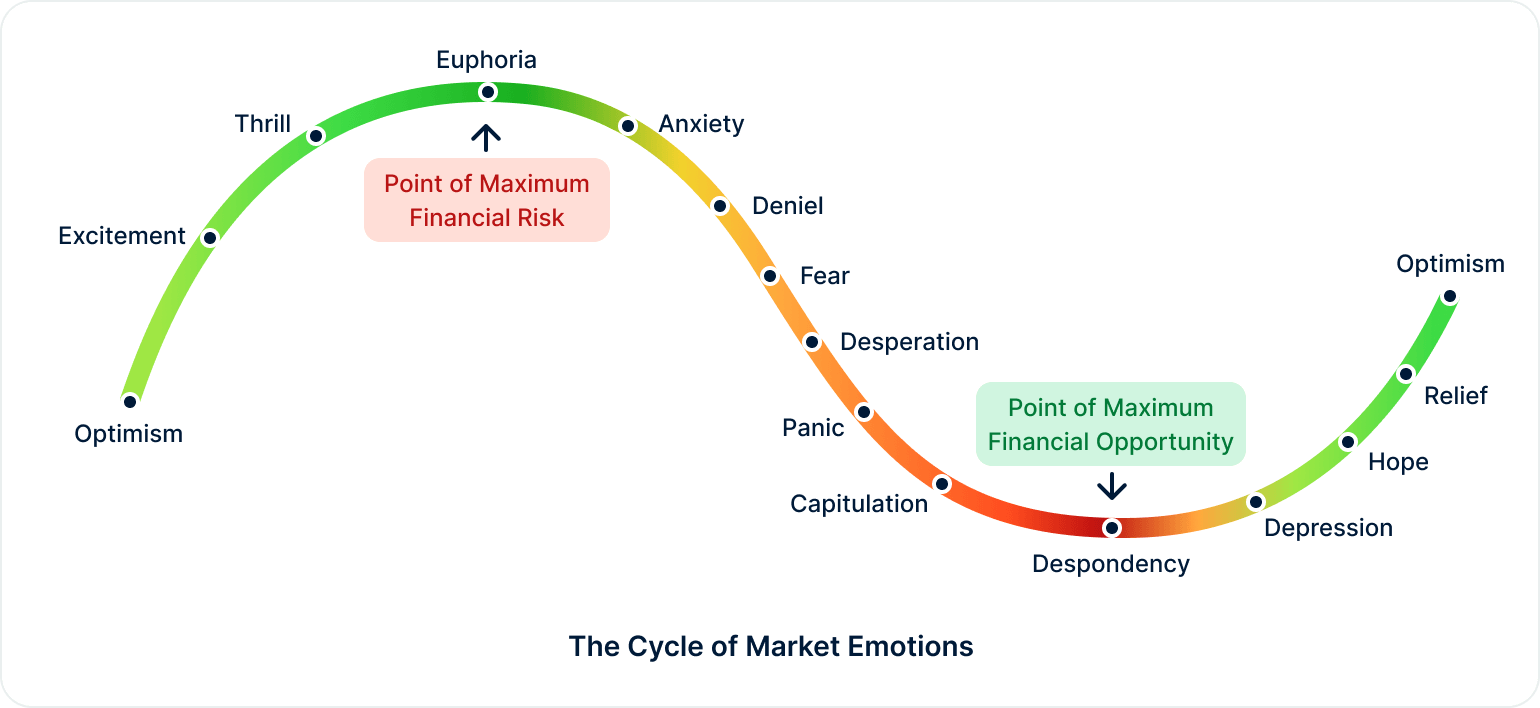
It’s important to remember that Bitcoin — like other cryptocurrencies — is highly volatile and goes through cycles.
In the peak of the bull run, Bitcoin’s price climbs to all-time highs! At the end of a bull run, Bitcoin’s price crashes.
Many traders wish to ‘time’ each cycle — in other words, buy BTC at the cheapest possible price and sell at the highest possible price.
The Bitcoin Rainbow Chart is a tool to help you better understand where the market currently stands and make better trading decisions.
While the Bitcoin Rainbow Chart can be a great tool, it shouldn’t be the only data point you should use when you decide to buy/sell BTC.
Remember, the Bitcoin Rainbow Chart is based on historical data.
If Bitcoin is near the top of the rainbow, it means that BTC may be considered ‘overvalued’. However, it’s also possible that demand for Bitcoin may have grown to a historically unprecedented level.


The Bitcoin rainbow chart uses colors of the rainbow to determine whether Bitcoin is overpriced or underpriced based on historical performance.


While the Bitcoin rainbow chart can be a helpful tool, it should not be used as a way to forecast future prices. The Bitcoin rainbow chart is limited because it only takes into account historical data and does not account for external events that could cause demand for BTC to grow.


Before you buy Bitcoin, you should consider multiple factors. This includes BTC’s current position in the rainbow chart, your current financial situation, and whether you are willing to tolerate Bitcoin’s volatility.


The Bitcoin Rainbow was originally created by the Reddit user azop in 2014. Since then, the Bitcoin rainbow chart has been considered a valuable tool in the BTC community.